
By Dan Kittredge for Agraria Journal: The Center for Regenerative Practice
As a child in elementary school I remember telling my science teacher that I was an Organic Farmer. The disdain with which she responded in front of my peers by saying "organic means contains carbon, so all farmers are organic farmers" sticks with me to this day. It was not actually that long ago that a group of back-to-the land homesteaders took a word that meant one thing in the world of science and redefined it to create a cultural touch point that now has a significant meaning globally.
In much the same way, food scientists have defined nutrient density differently than have those in the broader food movement. Specifically, they determine the nutrient density index of a crop by its average level of nutrients per unit calorie. For example, kale has on average a relatively high level of nutrients but a low level of calories. By this metric then kale has a high nutrient density score. Rice has many more calories in it per unit and so would have a low nutrient density score.
For the broader food movement, however, nutrient density has to do with quality, with how nutritious one bunch of kale is in relation to another. Or one bag of rice to another. Among food scientists there is an implicit assumption that all kale or rice is relatively nutritionally uniform. This assumption is foundationally flawed.
Dan Kittredge, Executive Director, BFA
My experience as a farmer has been that some crops have greater sheen, vigor, vibrancy, pest and disease resistance, flavor and shelf life than others. My understanding is that there are some profound nutrient variations in these crops, and these are really what I should be striving for rather than a label like Organic or Regenerative or local or Non-GMO etc. None of these labels correlate to the inherent nutritional quality of the crop and are effectively process standards, not quality standards. A crop is either organic or not, local or not. There is no subtlety or nuance in them.
For a decade, the Bionutrient Food Association, which I helped found and serve as executive director, has been working to expand our understanding of this new definition of nutrient density, and for the past four years we have been using the scientific process to do so.
We devised a strategy to move this process forward:
- Identify the nutritional variation that exists in crops so that an empirical definition of the nutritional density of any individual crop could be accomplished.
- Identify the environmental conditions and causal factors that relate to those varied nutrient density readings.
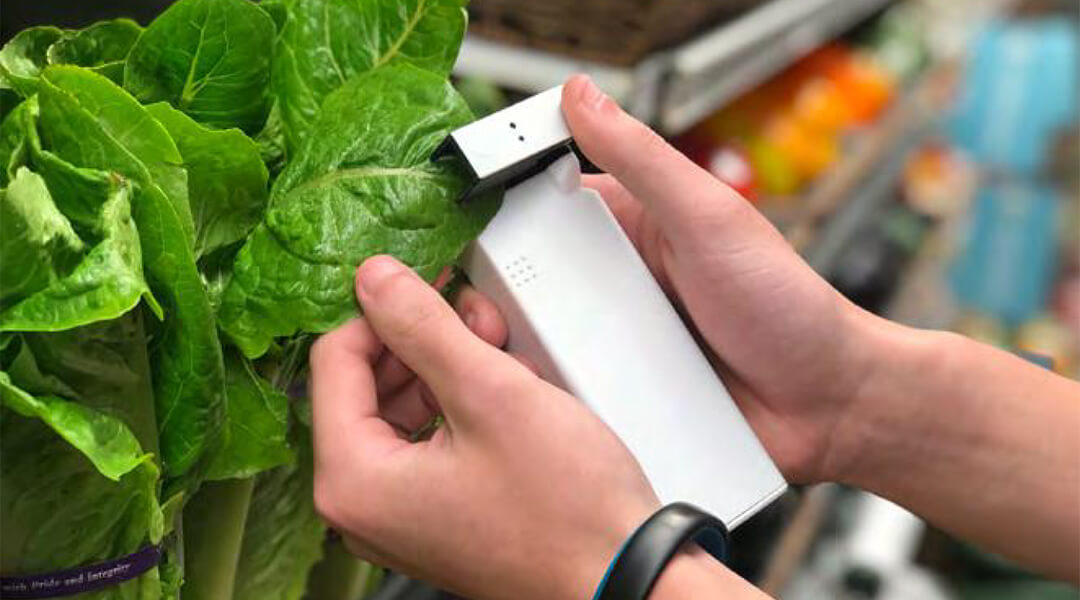
- Build and calibrate a hand-held nutrient density meter that anyone, from grower to consumer, could use to get a real-time assessment of the food they want so that there would be no need or role for a bureaucratic certification system.
- Engage as many aligned partners as possible who also had critical subject matter expertise. We call this partnership the Real Food Campaign.
In 2017, we created our first generation "Bionutrient Meter" and presented it at the Soil & Nutrition Conference that fall.
In 2018 we established our first lab to begin identifying the nutritional variation in food and chose two crops to begin with: carrots and spinach. We reached out to our community for volunteers and asked for samples of these two crops to be shipped to the lab. We received samples from gardens, farms, farm stands, grocery stores and farmers markets, ranging from Maine to Iowa. We got local, organic, and not organic. We looked at 16 different elements in the crops, like calcium, potassium, copper and zinc, as well as polyphenols and antioxidants, two well defined plant secondary metabolites associated with flavor and nutritional value.
The results we found in this first year of assessment were nothing short of astounding.
The variations for mineral levels were from 3:1 to 18:1. As in, this carrot has as much copper as those three carrots, and that leaf of spinach has as much iron as those 18 leaves of spinach. When it came to those higher order nutritional compounds, antioxidants and polyphenols, it was 75:1 – 200:1. As in this leaf of spinach has as many antioxidants as those 75 leaves of spinach and that carrot has as many polyphenols as those 75 carrots.
This variation did not correlate with local or organic or any other labeling or marketing type. Some non-organic carrots in a grocery store, for example, had much more nutrition in them than some organic carrots from the local farmers market.
In 2019 we added lettuce, cherry tomatoes, kale, and grapes to our assessment process along with soil from 35 farms where those crops were grown, and management and environmental conditions data like cover cropping, crop variety, soil minerals, tillage practice, soil carbon, fertility amendments and fertilizers, irrigation type, soil biological activity, mulching etc. With the 2019 data we now have the ability to overlay all of these different dynamics in relation to each other. After reviewing this information, although from a relatively small data set of 35 farms, it became clear that no one factor like type of seed, no-till, or fertility product correlates with nutrient density variation. It seems to be a combination of these factors.
Also in 2019 we were able to verify that the dramatic nutritional variation in crops, both in the mineral levels as well as the higher order compounds, is present in the broader spectrum of crops assessed. The most significant variation we found was the antioxidant levels in spinach: 364.5:1. That means if you ate one leaf of the highest antioxidant level spinach on January 1 of a year, you would have to eat one leaf of the lowest antioxidant level spinach every day for the entire year to get the same level as you received on January 1st of the most nutritious one!
Most impressively perhaps we were able to build a calibration on those six crops for our first-generation Bionutrient Meter. The calibration is not perfect, but we have proved that we can build a handheld spectrometer at a consumer price point that can be used in real time and non-invasively to give readings about nutrient density in food.
In 2020 we increased the number of crops to 20 and broadened our base of labs from the primary lab in Ann Arbor to the first satellite lab at Chico State in California and our first European lab, in partnership with Valorex, in the Normandy region of France. We added oats and wheat to our assessments, and we increased the number of farms we are getting management data from to more than 125. We will now have more meaningful data about environmental conditions. This will allow us to build correlations from management to quality in a way that should give significant insight to growers about what limiting factors they can change to increase overall function in the biological system of the operations.
This work has been accomplished solely through charitable donations so all information, raw data, hardware engineering, software code, etc. remains open source and in the commons in perpetuity. We want to make sure that free access to the best information is available to all globally regardless of resources. We hope to have a comprehensive definition of nutrient density with cutting edge spectrometers and a deep understanding of how to do more well within the next five years. The level of support for our work is really the primary variable.
---