
Measure Nutrient Density
Expensive lab testing is not a sustainable way to provide nationwide nutrition information. We must find cheaper, faster, and easier ways to measure nutrient density in produce. The technology is now emerging to achieve that goal, but we need help developing it.
Currently there is no way to directly and inexpensively measure a broad range of nutrients quickly in the field. First, you must perform a survey of nutrient density in crops and build a reference database of known nutritional data, relating it to simple measurements like reflectance to calibrate a handheld nutrition sensor.
Key design parameters
Measuring nutrient density is complex because “nutrient” is a vague and all-encompassing term. Depending on how you define it, nutrients might include hundreds of compounds that interact with each other and the body in complex ways. Furthermore, each compound is measured using a different lab method, and each individual method can cost hundreds of dollars.
In reality, however, we care less about specific compounds and more about the cumulative impact of a food on human health. In fact, a myopic focus on specific compounds is ultimately counter-productive, leading to a shifting carousel of “superfoods” that drive sales but not health outcomes.
Therefore, a nutrition sensor should measure the broad range of nutrients and compounds that impact human health. Measuring individual compounds may be representative of a class of compounds, but is not required to achieve our goals.
These are required design features for our nutrition sensor:
- Inexpensive
- Easy to use
- Safe
- Interpretable results
- Measures the whole sample (not just the skin)
- Correlates to classes of nutrients of interest
- Open source
These are optional design features:
- Detects specific compounds
- Non-invasive
- Inexpensive to calibrate
- Incurs no recurring costs (consumables, reagents, etc.)
Available technologies
Although technology is always shifting, these hand-held technologies fulfill some or all of our design constraints:
- Raman spectroscopy
- Laser-induced breakdown spectroscopy (LIBS)
- Reflection in the ultraviolet (UV), visible (VIS), and near infrared range (NIR)
- Microfluidics
Here is a breakdown of how each of these technologies fits this application: (For a detailed description of these technologies, see Appendix A).
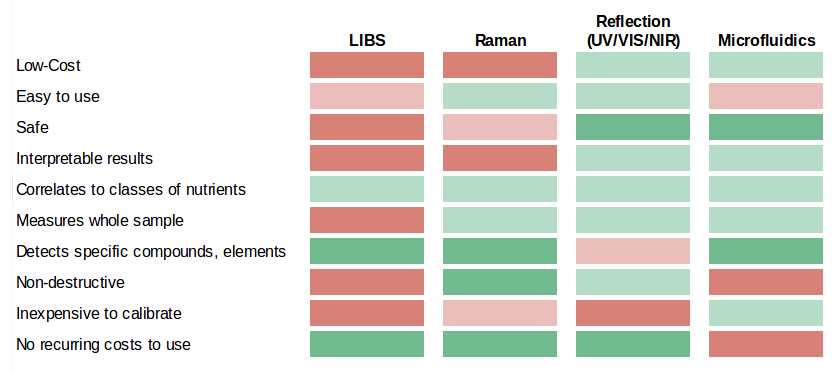
Although Raman and LIBS are able to identify some specific compounds, they are too complex and expensive for our purposes. Microfluidics is also attractive but requires significant research and development to convert current lab nutritional measurements to a microfluidics platform. Although this is a worthwhile endeavor to explore in the future, it is impractical to apply today.
Currently, only reflection in the UV/VIS/NIR ranges is technically possible at a reasonable price. It provides a uniquely low-cost option for measuring nutrient density. Improvements in LED and sensor manufacturing are driving down the cost and widening the range of measurement. Reflection is already used to successfully identify food fraud, but making correlations to classes of nutrients (which is significantly more complex) remains untested.
Proposed strategy: reflectance
A low-cost, handheld nutritional sensor is not commercially available precisely because there are no perfect options. However, we believe that reflection in the UV/VIS/NIR is the best option to broadly measure nutritional density today.
The initial crop survey(s) will provide the data to test the first key hypothesis: reflection measurements correlate to nutrient density. (See Appendix B for why we feel this hypothesis has a high likelihood of being confirmed.)
Correlating reference data with reflectance
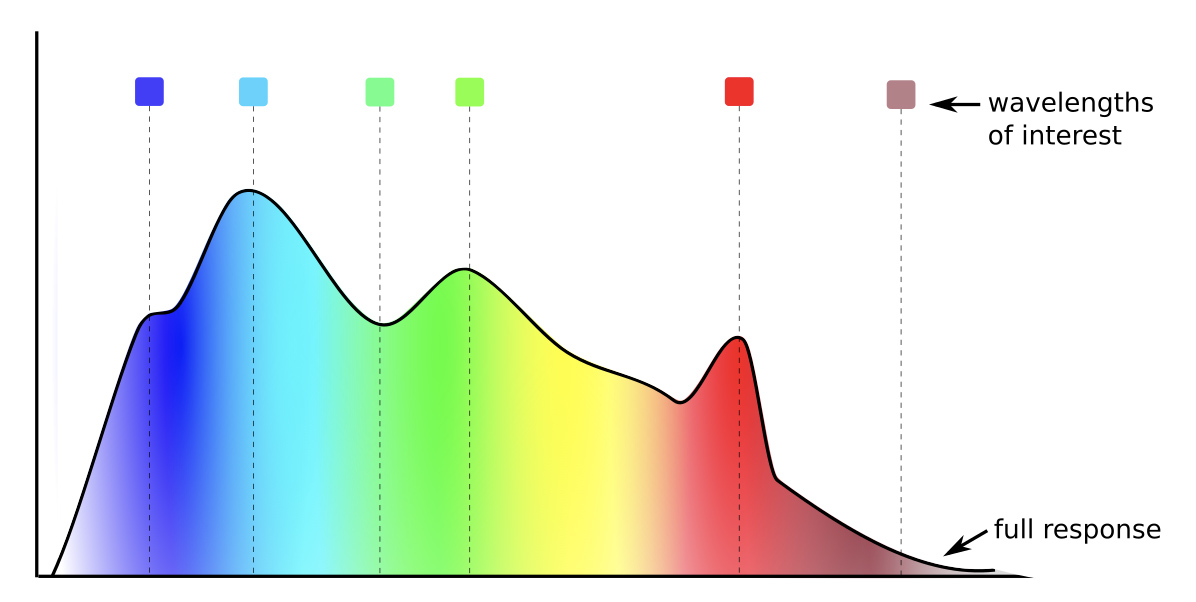
Our Core Survey intends to collect at least 180 samples over 3 years. Using widely accepted laboratory methods, we will test each sample for a range of vitamins, minerals, and secondary metabolites. In addition, we will measure samples using a full spectrometer to maximize available reference data and the chance of identifying correlations. Using this data, we will identify the key wavelengths that drive the correlation from the full spectral response (see graph below). We will then build LEDs at those wavelengths into the handheld unit.
Benefits of the LED/photodiode strategy
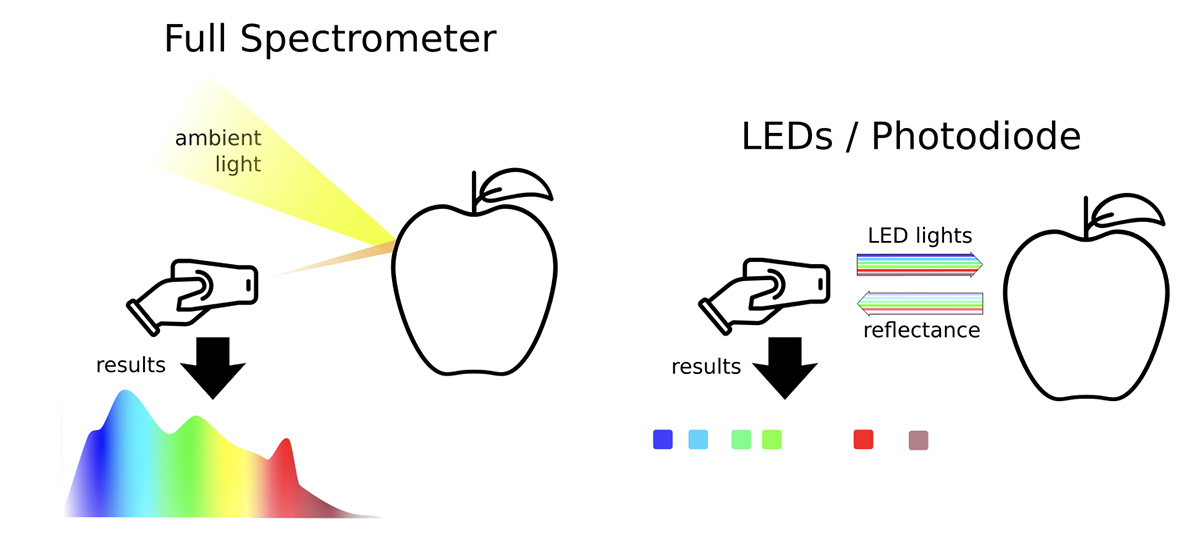
We favor the LED/photodiode strategy instead of building a full spectrometer in the field because:
- A full spectrometer is expensive. The cheapest and smallest is $120 from Hamamatsu. A dramatic drop in the cost of LEDs at less than $2, an increase in wavelength specificity, and the availability of low-cost, high-quality pin photodiodes at less than $5 makes the LED/photodiode option relatively inexpensive.
- The LED/photodiode strategy can utilize pulse amplitude modulation (PAM), but a full spectrometer cannot. PAM eliminates signal from non-pulsed sources, such as the sun or background lighting, providing a more consistent and comparable signal of interest in real-world conditions. PAM uses short pulses of light to actively probe the sample and has been used successfully for years in handheld fluorometers to measure photosynthesis in plants, an application requiring high accuracy in wide-ranging environmental conditions.
- The proposed LED/photodiode designs are flexible in the wavelengths measured. Once we identify the wavelengths from the survey, we can easily modify the design to include those wavelengths.
- They are in season and harvestable at roughly the same time in all zones, lowering the cost and effort required to collect the samples.
- They are widely consumed, major crops (in the top 20).
- In previous studies, carrots have shown significant variation (100x) in beta-carotene, which is easily measurable using spectroscopy.
- Both vegetables are physically consistent enough to use spectroscopic methods (unlike broccoli or peppers, for example, which have large air pockets and complex surfaces).
- Having one solid vegetable and one leafy green provides a broader learning opportunity for method development.
- Juice can be extracted easily from both, allowing for possible infield refractometry and spectrometry in the future.
- Lower costs by:
- Using BFA's membership to collect data for free from across the country
- Working with a non-profit lab (HRI) whose prices are 20 percent lower than commercial alternatives
- Correlating a full (expensive) nutritional test with a cheaper, simplified test to drive down testing costs in the future
- Extend the public discussion by:
- Collecting data over three years so we can incrementally improve the survey and extend the public discussion about nutrition
- Build long-term revenue streams by:
- Providing fee-based testing services for farmers and consumers not part of the survey to increase the flow of data and offset the cost for the testing equipment
- Identifying partner organizations (academic or industry) willing to pay to expand the survey to new locations or new produce for their own research needs
- Efficiency (cost per unit)
- Impact on public health
- Public awareness of their meaning
- Variety of nutrient type
- Likelihood of correlating to simpler test methods
- Cost per test
- Equipment requirements (expensive machines)
- Simplicity (anyone could do it)
- Testing time
Build capacity within the BFA staff and membership to perform large-scale nutrition surveys.
As an advocacy organization, the BFA has a large, motivated, and engaged base of members. This project will test the capacity of members to collect high-quality samples and data. It will also build knowledge among BFA staff and partners to build and run a nationwide survey. Together, the BFA and its membership will have the capacity to expand the survey in the future.Identify statistically significant nutritional differences between organic, conventional, locally sourced, and non-local produce.
The experimental design of this survey, although limited in scope, will provide opportunities to identify even small differences in food quality (see sub-section “Survey Design”). The differences identified in this survey will allow future surveys to be more targeted, decreasing cost and increasing impact.Communicate results effectively to the public.
- The survey data will be posted on the BFA website, which receives ~10,000 page views per month, in a fully searchable form. Anyone will be able to map and analyze the data through the site or download it.
- Yearly reports will be generated and distributed through the BFA membership, at the annual BFA conference (more than 800 members, and 500 conference attendees) through the classes and talks. These reports will be in PDF form, detailing the highlights from the survey as well as other relevant published data from the previous year.
- The BFA will run a social media campaign after each report is released (for example, BFA Facebook page is 2,300 followers and growing).
- The BFA will publish at least one peer-reviewed article about the results from the survey. Ideally this publication will be pre-published in year one, with the results emerging in year three.
Lower the cost of the survey in the long term by identifying relationships between the expensive standard nutrition methods and less expensive methods.
The BFA will publish at least one peer-reviewed article relating standard nutritional tests with UV/VIS/NIR methods and refractometry, and identifying opportunities for future research.Leverage this survey to engage researchers, food activists, and additional funds to expand the survey in future years.
- In years two and three, offer paid services to farmers and consumers for food quality testing. This expands the scope of the survey while generating income to offset survey costs.
- Identify at least three researchers in food nutrition and human health to add modules to the basic survey to research their topics of interest.
- Apply for at least two additional funding sources to expand and continue the survey beyond the third year.
- Data sharing. This allows consumers and producers to track nutrient density in markets and on farms, and enables researchers to utilize the data to improve farm practices and develop new sensors.
- Method sharing. Successful farm practices should be delivered to the farmer natively through FarmOS, providing real-time suggestions and updates (think of a personal assistant that makes sure you are on track for your fitness goals).
- Anonymization. Farm and consumer data can be anonymized to the county or state level so sharing doesn’t trigger privacy concerns. We are building a public database to enable research for improving tools, techniques, and methods, however, anonymization is also needed to ensure users feel comfortable.
- Connecting farmer practices and nutrient density. The BFA has already been using low-cost tools like refractometers to estimate nutrient density for years. Now, using the platform described above, broader and more rigorous research is possible. Using its own members, the BFA itself will create a research agenda to build a data pipeline of farm practice and food quality. Once established, research partners like the Rodale Institute, UNH, PASA, and other partners can leverage the data pipeline to answer research questions.
- Connecting nutrient density and human health. BFA research partners at Penn State, Ohio State, and the University of Montana, along with the Health Research Institute, can access the data and network of participants to produce high-quality human health research. Specifically, the breadth and depth of the network will allow for multi-factor studies between human health and quantitative values for a range of nutrients of interest. Previously, multi-factor studies have not typically been performed and reported on in the literature because of the cost associated with collecting the data and the number of samples required to get statistically significant results.
Below are simplified visual descriptions of a full spectrometer and a device using the LED/photodiode strategy.
Future strategies
The LED/photodiode strategy today uses the same calibration information as a full spectrometer, so switching strategies in the future remains possible. If prices drop, the technology improves, and there is a clear benefit to including the full spectrum in the field, the reference data is still available to calibrate a full spectrometer.
Finally, both strategies have high-quality, fully open-source designs that are already available using standard equipment. The MultispeQ has firmware and hardware designs for the LED/photodiode option, and there are several options for the full spectrometer, including the GroupGets breakout board, the CoralspeQ, and breakout boards provided by Hamamatsu. These designs and firmware reduce the cost of development and are consistent with the public and open nature of the project.
Prototype builds on existing designs. We will build 8 beta prototype low-cost, handheld full-spectrum UV/VIS/NIR reflectance devices and use them with partner labs (HRI) to calibrate a reference nutritional database.
We will use the core design from the MultispeQ V1.0, available here, with modifications to reduce costs. We will also use the MultispeQ firmware with modifications. This dramatically reduces the design time and cost required to have a working prototype version. (For the sake of comparison, the original development of the MultispeQ cost about 1.5 million dollars and took 3.5 years to complete.)
The proof of concept for effective reflectance measurements is already completed. Modified versions of the MultispeQ have already been tested in reflectance mode by swapping the pin photodiodes to be positioned on the same side as their respective LEDs. This is an example project that correlates reflectance values to total carbon in soils across hundreds of samples with success. It is structurally very similar to correlating reflectance values to nutrition measurements.
The MultispeQ was designed to measure absorbance, resulting in sensors and LEDs on both sides of the sample, two separate circuit boards, and a relatively complex mechanical design. It was also designed to achieve very high accuracy to measure photosynthetic parameters, which are outside the scope of a nutritional sensor.
We will redesign the nutrition sensor specifically for reflectance, reducing the cost and improving usability as compared to the MultispeQ. An initial estimate of savings is described below. Total unit costs would drop by more than $100, and up-front costs would drop by $23,000. For more details, see below:
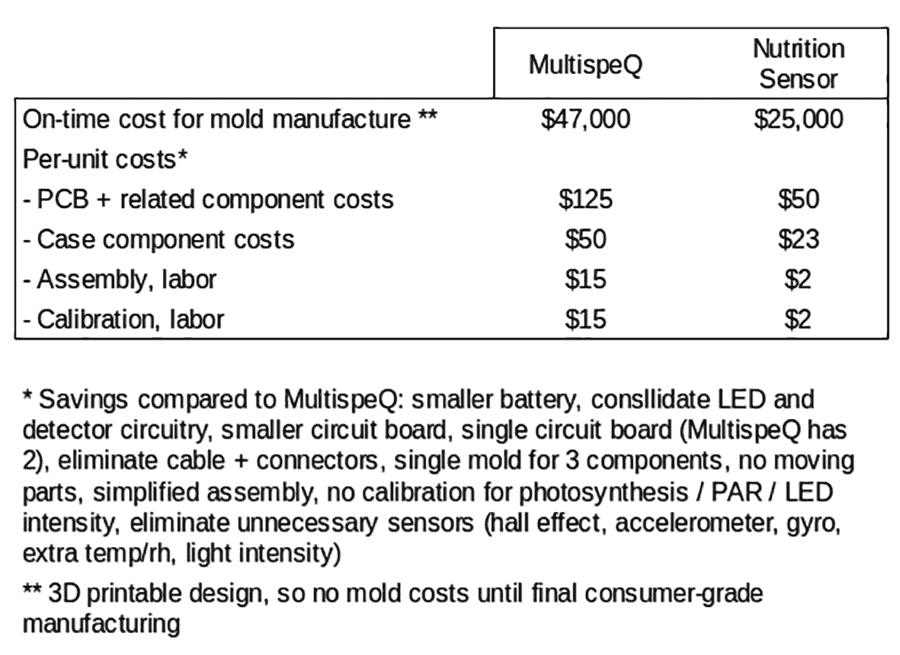
The core MultispeQ V1.0 circuit was an improvement on the MultispeQ Beta. Both versions have been field-tested for more than three years on several hundred devices, in field and lab conditions, in more than 15 countries. Heavily involved in the design of the MultispeQ and with unique knowledge of its function, both Greg Austic and Jon Zeeff will perform the design work on the Bionutrient Meter.
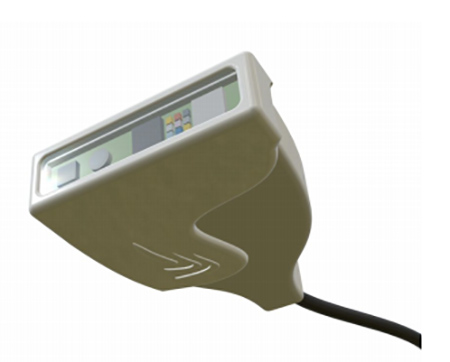
A conceptual rendering of a reflectance-based device on the MultispeQ architecture is shown to the right. This does not represent the final product, but gives a sense of the size and scale of the device we will manufacture.
Design Process
The core requirements are outlined in the Design Parameters section above, but here we provide greater detail about the design process.
1) Evaluate application
We will evaluate how the device will be used, who will use it, and what the design requirements are. The evaluation stage is a collaborative process with developers, designers, and users to identify the nexus of what's possible, what's optimal, and what’s practical.
Users will include BFA core staff, collaborators as part of the Core Survey, including Kris McCue and Faith Reeves, and Dr. John Fagan from the Health Research Institute. The concept (how it works), features list (what exactly it does) and spec list (how well it does it) that emerge from this stage will define the rest of the process. The concept will include draft drawings and user stories.
Outputs:
→ Concept
→ Feature list
→ Spec list
2) Test assumptions
In this phase, we will create components to test any assumptions we’re not confident about from the feature list. If an assumption fails, we redesign and retest until we get it right. If we can’t get it right, we drop or adjust the feature. This is a "fast fail" stage, with breadboard, simple circuit designs, and 3D printed parts. We test assumptions both on the circuit and on any mechanical designs.
3) Debug design
Once we test the core assumptions, we will design and assemble a full draft circuit board and case. We’ll identify the first round of bugs, and produce and retest another version. Once we’ve produced a working device, we’ll test the spec list against the actual performance of the device. If something on the spec list fails, we will reevaluate and retest the design until that spec is achieved.
Outputs:
→ Draft device (minimum 1 device)
4) Finalize design
If we achieve all specs and features on the draft board, then we can finalize the case with some aesthetic details in mind. Any design changes will likely require at least a few iterations to identify any remaining mistakes. Features and specs will be rechecked on the final design to ensure nothing was lost in the final design. Once complete, we will assemble and test eight devices.
Outputs:
→ Final devices
5) Beta test
At this stage, we put final devices in the field for use. This almost always requires follow-up and sometimes hardware patches. Of the eight devices manufactured, at least two will be sent to the Health Research Institute (HRI) for testing in the Core Survey, alongside a traditional spectrometer. HRI may also use the devices with any of their other customers who would be willing to make their results public, potentially building partners and expanding the dataset. The remaining six devices will be split between the development team, BFA staff, early backers of the crowd-funding campaign who contributed at the $10,000 level, and other nutrition labs in industry or academia who may want to participate in alpha testing.
We will use the open-source PhotosynQ web back end and mobile app during the Core Survey for collecting data from the devices. Although this is not the desired long-term solution for data collection and sharing, it will provide beta testers an easy-to-use interface and will store the data for future use. It also allows critical metadata generated by the survey to be combined with the sensor data in an easy and validated way. Analysis of the final data is also included in the project plan for the Core Survey.
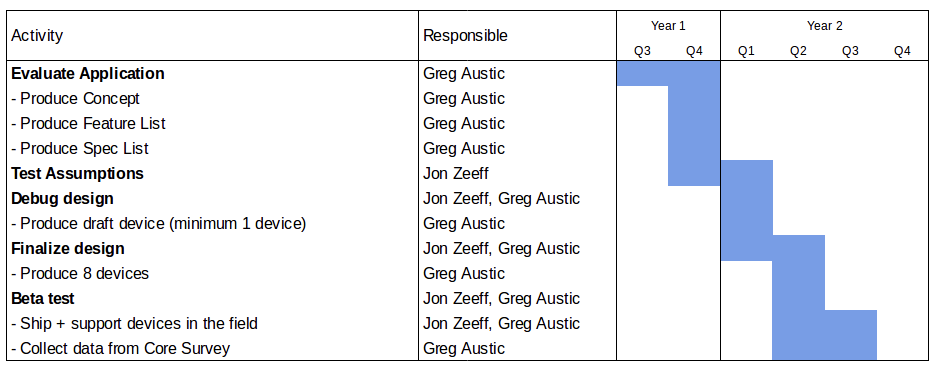
Timeline
We will complete the design process by the time the Core Survey is ready to test samples in mid-summer 2018.
Dynamic Link: http://bit.ly/2pXpKl4
Budget
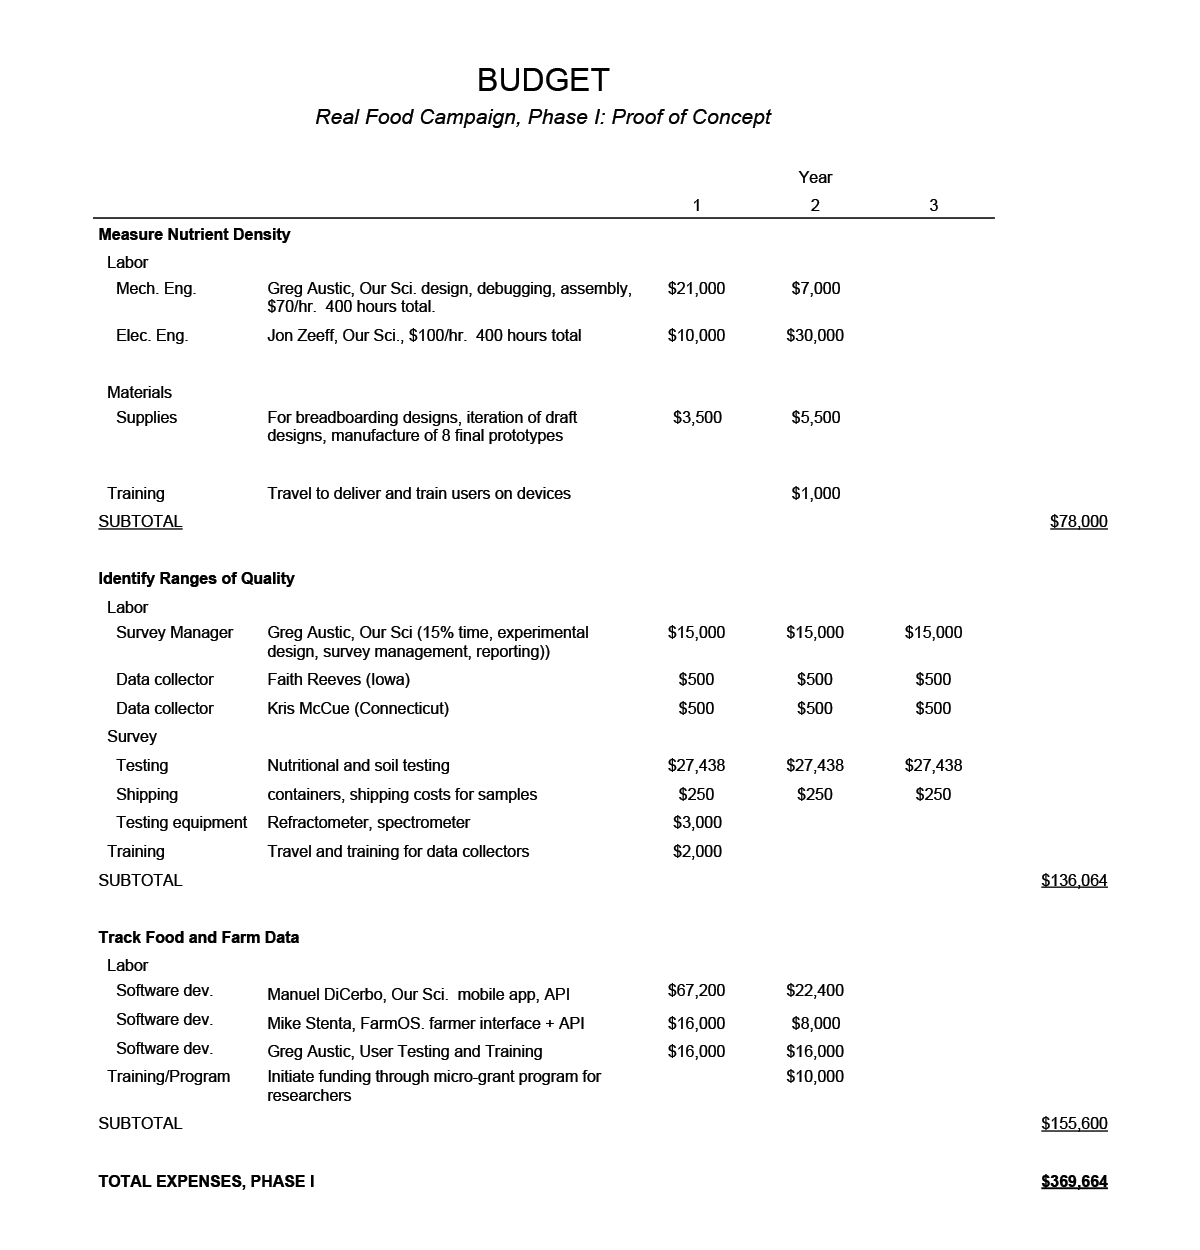
(click image to view larger)
Dynamic Link: http://goo.gl/ZMdnsB
Identify Ranges of Crop Quality
We plan to ultimately track nutrient density in hundreds of crops, but will begin with just one or two. A likely scenario is testing carrots and spinach in two regions: Connecticut and Iowa.
We will process each sample using standard AOAC and US Pharmacopia methods, as well as a simplified method, using the device for UV/VIS/NIR reflectance, to establish a correlation between the two and provide information that will allow calibration of the Bionutrient Meter’s sensor. Correlating these tests will also reduce the cost of future work by allowing us to use a simplified method in place of standard methods.
Initial sampling regions
We plan to initially test crops in two regions with contrasting soil types (for example, histosols in Connecticut and mollisols in Iowa). The soil profile, microclimate, and soil type in Connecticut and Iowa are also relatively consistent, so farm-to-farm variation in soil quality should be low. More regions would introduce too much sample variation from differences in collaborators and soils.
Vegetables to test
To begin, we favor testing carrots and spinach for several reasons:
Benefits of HRI/BFA involvement
BFA-trained members will collect the data and the Health Research Institute (HRI) will test the samples. This strategy leverages the testing expertise of HRI as well as the strengths, reputation, and integrity of BFA in the agricultural and food sector, positioning the BFA to perform the survey at minimal cost and outside support in the future. It facilitates the following:
Addressing variations in testing
Three suppliers will be sampled for each Management x Location x Region x Crop group. To reduce variation within each of these groups, each supplier’s sample will consist of five individual samples (for example, five individual carrots from the same supplier), which are combined before testing. Test-test variation is always present, but the methods being used have known test-test variation, which we will assume also applies to our samples.
Sample size considerations
Given the lack of data on nutritional testing in stores and farmer’s markets, it is hard to estimate exactly the expected differences between groups and decide on a "reasonable" sample size. However, some historical data can set basic guidelines. We see the variation in beta-carotene between carrot varieties in Takahata et al from 0 to 25mg / 100g sample,1 while Pinheiro-Santana et al found a mean of around 7mg / 100g sample.2 Both saw standard deviations within the population at around 1mg / 100g.
Assuming we have a similar variance within our populations, we can roughly calculate what the expected minimum statistically significant difference between populations would be at any given sample size. (See Appendix C for calculations.)
Assuming we compared beta-carotene among organic carrots (24 samples) versus regenerative ag (12 samples) in year one and two, a difference greater than 0.8 mg/100g should be statistically significant (two tailed t-test using alpha = .05 achieving a p-value ~ .02). By year three, the same comparison would include 18 and 36 samples per population. In this case, differences as small as 0.6 mg/100g should be statistically significant. Given Takahata showed a varietal variation is 25 mg/100g sample, 0.6 mg/100g is reasonable for detecting differences in the population means.
Given these considerations as well as cost constraints, we have determined sampling sizes for our crop survey. Even at reduced rates provided by our nonprofit laboratory partner, the cost of testing limits the number of samples we can test. Therefore, we will perform 30 nutritional tests from 30 samples for each crop in each year. For each crop in each year, 18 soil samples from participating local farms will also be tested for soil quality. See "Testing Methods" section below for details about soil and nutrition methods.
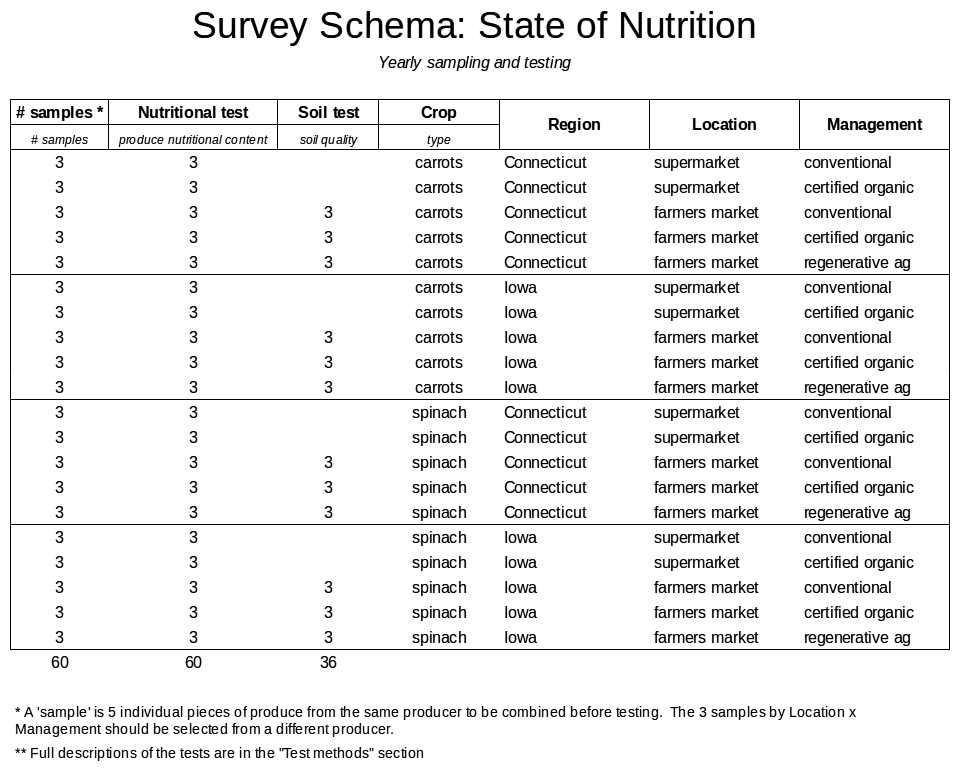
Variables
The crop survey may include the variables below. In addition, we will collect other relevant metadata that may impact the dependent variables (who collected the data, the name of the store/market, name of the producer, time of day collected, etc.)
Independent:
Parameters to be varied within the experiment.
| Crop | (carrots, spinach) |
| Region | (Iowa, Connecticut) |
| Location | (supermarket, farmers market) |
| Management | (conventional, organic, regenerative ag) |
| Management details | for samples from local growers only (management questions like no-till, fertilization details, etc.) |
Controlled:
Parameters to be held constant across all samples.
| Sampling method | (cold packed, next day shipped, tested within 48 hours) |
| Sampling season | (sampled during peak harvest) |
Dependent:
Measured outputs from each sample. For details on each test type, see Sampling Methods section below.
| "Nutritional test" | Vitamin A, K, Amino Acids, Total Phenolics, Minerals (36), Beta Carotene, UV/VIS/NIR and refractometry |
| "Soil test" | Soil carbon, soil biology, cations, Minerals (36) |
Sampling methods
It is widely known that ripe produce loses nutritional value quickly after harvest. It is therefore important to have consistent sampling methods from the marketplace to the lab to keep data quality high. Data collectors will have kits for collecting samples, and they will collect all samples at the same time to reduce sampling and labeling error. Data collectors will immediately label samples, seal them in a bag, place them in an insulated container with dry ice, and send them to the lab for analysis. They will be stored at -80C in the lab until testing. The time from collection to analysis will be held constant at 48 hours.
Testing methods
Nutritional analysis is performed on all samples, and includes both standard methods (AOAC, etc.) and simpler methods (UV/VIS/NIR, refractometry).
We chose standard methods based on the following parameters:
We chose simplified methods based on the following parameters:
Soil sampling
Samples originating from local farms (⅗ of all samples, total of 108 samples over three years) will also have soil samples collected. Soil sampling methods were chosen to help identify overall soil health (carbon and microbial activity) and mineral content, which may relate to mineral content in the produce eaten. Soil data could identify differences in soil quality based on different types of farm management, and provides a link between soil and produce quality.
Desired Outcomes of the Crop Surveys
Track Food & Farm Data
We propose to create a software platform to collect and analyze data about food quality and farming practices, and organize communities of practice around that data. This will be a place to provide feedback, collaborate, and organize research on nutrition and farming practices and a resource for the broader community. This platform will build on resources that are already available. By building on top of well-developed platforms, FarmOS and Our-Sci.net with existing user bases, we avoid a “build-it-and-they-will-come” strategy, which is both expensive and unresponsive to feedback.
Establish Software Platform
Combined, FarmOS and Our-Sci.net have already invested millions in software and hardware development and years of user testing, significantly reducing the cost to BFA in starting a similar project from scratch. In turn, BFA’s involvement and contributions will benefit their business models and contribute to their success.
Data collection is already possible through Our-Sci.net and FarmOS, but communication between the platforms is not currently possible. In Phase I, we will need to develop application programming interfaces (APIs) (ways for programs to communicate information) to connect the two platforms. The APIs consist of three main components:
Build Research Communities
The software and hardware is the scaffolding on which work gets done, but the BFA and its partners will also contribute. This means expanding BFA membership, strengthening partnerships with research organizations, and training to ensure the highest quality research is being performed.
In Phase 1, we will build partnerships in these core areas of research:
1 Takahata Y et al. Japan. J. Breed. 1993;43:421–427. https://www.jstage.jst.go.jp/article/jsbbs1951/43/3/43_3_421/_pdf, see Table 1.
2 Pinheiro-Santana H M et al. Food Science and Technology (Campinas).1998;18(1): 39–44. http://www.scielo.br/scielo.php?script=sci_arttext&pid=S0101-20611998000100009, see Table 4. Convert from ug/g to mg/100g