
The full Report and Analysis for 2019 can be found at https://lab.realfoodcampaign.org/reports/rfc-2019-final-report/.
Introduction
The Bionutrient Institute emerged from a collaboration between the Bionutrient Food Association and its membership, Next7 and Our Sci LLC in 2018 with three primary goals:
- Determine the amount of variation in nutrition in the food supply.
- Relate soil health and nutrient density outcomes to crop and soil management practices.
- Predict nutritional parameters in produce using spectral data and metadata.
In its first year of operation, it was demonstrated that there was significant variation (up to 200:1) in antioxidants, polyphenols and minerals in carrots and spinach. It was also found that spectral reflectance data could be used to correctly identify high (>50% percentile) antioxidant and polyphenol content 73 – 86% of the time. However, crop and soil management data was insufficient to identify relationships between management and nutrient density outcomes.
In 2019, we sought to both improve the efficiency and quality of data collection and to expand the number of samples analyzed by the lab. Significant changes to the program in 2019 included:
- Expanding the total number of samples from 800 (in 2018) to 3000-4000 samples.
- Expanding the number of crops from 2 (carrots and spinach) to 6 (carrots, spinach, kale, lettuce, cherry tomatoes and grapes.)
- Increasing the reflectance wavelength range measured from 365 nm – 940 nm in 2018 to 365 – 2100 nm by adding an additional spectrometer to the lab process.
- Collecting more detailed farm management data by creating a "Farm Partner Program" to work directly with 30-45 farmers to collect both samples and granular management data.
- Revising lab processes based on lessons learned in 2018 to reduce major sources of noise and eliminate unnecessary tests.
Design
The project relies on a very active and passionate community to provide samples to the lab to drive the research. In order to effectively engage with this community at a scale large enough to meet our sample goals and increase the amount of granular data collected we needed:
- Easy-to-use data collection tools that promoted consistent data entry.
- Automated data management systems to better track community activity and sample flow from the field to the lab.
- Traceability so that lab results could be traced back to specific management practices in the field.
In 2018, data collection was done using paper-based surveys, which was both inefficient and prone to errors. In 2019, we released the RFC Collect mobile app, which allowed staff to create standardized data collection surveys to capture key sample data and eliminated the need for paper-based surveys.
In order to capture more granular farm management data while still analyzing a diverse set of samples from stores, farmers markets and farms across the country, we set up two distinct community partner programs in 2019:
- Farm Partners Program: We would work directly with farmers who were willing to share management and variety data and to send samples into the lab. The data collected by these partners would be much more detailed than what was collected in 2018 or what was collected by Data Partners.
- Data Partners Program: Similar to the 2018 Data Partners Program, data partners could be anyone who was interested in submitting samples to the lab. Data partners would submit samples from stores, farmers markets and farms in their area.
Farm Partners Program
Our goal was to recruit 30 - 40 Farm Partners. Recruitment was done through a combination of an informational booth at the BFA Soil & Nutrition Conference in November, 2018 and through the BFA newsletter. After receiving interest from 103 farmers, we enrolled 34 Farm Partners. Additionally, we collaborated with 10 farmers from the Massachusetts chapter of NOFA, bringing the total participating farmers to 44. All participating farmers were trained to use the RFC Collect App for data collection, given a 1-year subscription to FarmOS (an open-source farm management platform) and were provided sample packets that included pre-labelled sample bags, a soil probe, an android phone (if needed) and postage-paid shipping envelopes. We worked directly with FarmOS, with support from OpenTEAM, to build integrations in the RFC Collect app, so that Farm Partners could push and pull data between their FarmOS and RFC Collect accounts.
In short, for every sample submitted, Farm Partners:
- Map the field in FarmOS. These fields were then available to be referenced in the RFC Collect App so the lab could trace each sample back to a specific field.
- Complete a "Planting Form – Farm Partners" survey that captures key crop management data such as tillage, addition of amendments and whether the crops were planted in the field directly from seed or transplanted.
- Record post-planting management by completing the "In Season Management Form – Farm Partners" survey once per crop or multiple "Weekly Management Form – Farm Partners" surveys during the growing season.
- At harvest samples and metadata were collected. Each sample included the crop and two soils samples–in depths increments of 0-10 cm and 10-20 cm–from within 12 inches of the crop sample. A "Sample Collection Survey" was completed to capture key sample metadata (crop variety and the sample number from the provided sample bag) and ship the sample to the lab.
Data Partner Program
In order to capture variability across food supply chains and meet our goal of analyzing 3,000-4,000 food samples, we needed volunteers who were willing to submit samples from stores, markets and farms from across the USA. We recruited 26 volunteers, called Data Partners, from the BFA Soil & Nutrition Conference (2018 and 2019) and the BFA Newsletter in three cohorts throughout the year.
Data Partners were provided with a sample packet, including an android phone (if needed), a soil probe, pre-labelled sample bags and postage-paid shipping envelopes. They were asked to collect samples from stores, farmers markets and farms in their area on a weekly or bi-weekly basis. A detailed sampling plan was developed for each Data Partner to provide some guidance and to ensure that we were receiving food from a diversity of management, source and produce types.
When sampling, Data Partners completed a "Sample Collection Survey" which captures key sample metadata. If samples came from a store, metadata included labeling information (certified organic, greenhouse grown, etc). If the Data Partner visited a farmers market or farm, then sample metadata included farm practices (organic, no-till, cover cropping, etc), use of irrigation and types of amendments used (mulch, compost, fertilizer, etc).
Implementation
The lab received 2,095 samples from across the USA in 2019, with 813, 230 and 988 samples coming from farms, farmers markets and stores, respectively and 63 samples where the sample source was not known. While the samples collected fell short of our goal of 3,000 samples, we were able to source samples from a wide variety of states, farms, stores, and store brands, see the Sample Diversity Table on the next page. Farm partners submitted 438 samples, and the lab received detailed planting and post-planting management data for 92% and 87% of those samples, respectively. The remaining samples were received from 26 Data Partners. Working directly with farmers helped us collect detailed crop variety data, with 92.4% of samples arriving from Farm Partners having variety data compared to 79.2% of farm samples from Data Partners. Likewise, variety data was only available for 21.7% and 18.7% of samples from farmers markets and stores, respectively.
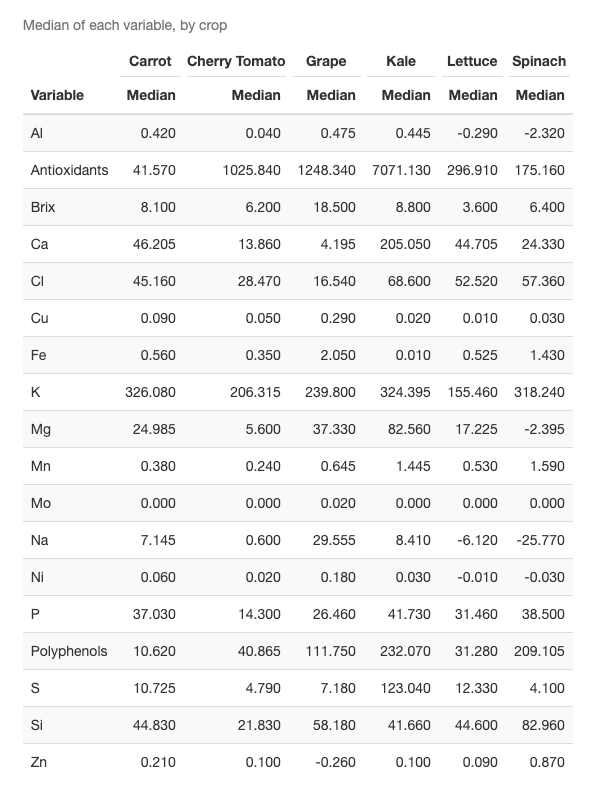
For each of 6 crops, the table above shows the median of each nutrient listed.
Units are: Antioxidants — uM Fe2+ equivalents per 100g fresh weight.
Polyphenols — ug/ml Gallic Acid equivalents per 100g fresh weight.
Brix — brix value (using digital brix meter / refractometer).
Minerals – All minerals (S, P, K, etc.) for soil and crops are reported in parts per million (ppm) except silicon in soils, which is in %.
The table above also shows the ratio, for each crop, of the sample with the highest value for that nutrient compared to the sample with the lowest value, a measure of the variability for that nutrient in each of our tested crops.
The median concentration and the max:min ratio of each nutrient are presented in the table above for each crop. Not surprisingly, kale was the most nutrient dense of the crops analyzed in 2019 with the highest levels of antioxidants, polyphenols and many minerals. There was also significant variation across all nutrients and crops measured in 2019, with the max:min ratio ranging from 3 to over 500. While part of this variation can be explained by the wide range of samples that were analyzed, it shows that not all food is created equally.
Determining the Causes of Variation
This Classification Table of crop antioxidant and polyphenol levels allows the quick comparison of the analysis methods listed down the left. Metadata records color and crop source. Bionutrient meter is a handheld device, Siware is an expensive hi-tech device, both analyze reflected light, whether from surface (non-destructive) or juiced sample (destructive). Individual methods as well as combinations are measured, enabling fuller comparison. The darker the color in the box the more reliable the lab considers the reading.
Separating out the causes of variation in a large observational study such as this can be very difficult. Some of those causes of variation, like climate region or soil type, farmers have no control over. Other sources of variation, like farm practices, farmers can control. So we will focus on those results here.
The graphs on the previous page show the effects of different farm practices or food labels on multiple crop nutrients, averaged across all 6 crops the analyzed. For example, the antioxidant shift with cover crops was about 0.1, meaning that cover crops boosted antioxidant content by 10% compared to produce with no practices listed. While no graph has all positive or all negative shifts, we do see some clear trends. For example, practices that can increase soil health, such as cover cropping, no-till and organic, tend to have mostly positive shifts. On the other hand, crops grown in more artificial environments, like greenhouses and hydroponics, had more negative shifts.
Predicting of Variation
The lab is using the Bionutrient Meter, a low-cost handheld device, and more expensive benchtop instruments to develop tools to predict nutrient density in foods. These models can be developed for consumers (non-destructive methods like scanning the surface of produce in the grocery store) or supply chain models (where a small amount of sample can be destructively sampled by juicing). The classification table on the next page provides more details about our findings, but here are key findings:
- The Bionutrient meter, combined with the appropriately attainable metadata, is just as effective at predicting nutrient quality as the much more expensive and complicated benchtop Siware device.
- Using the variety data may provide a large boost to the predictive capacity of the Bionutrient meter. For this reason, we should put more emphasis on capturing variety data in 2020.
- The best predictive capacity came when attempting to predict the highest (top 25%) and lowest (bottom 25%) nutrient densities. In this case the model lumped all the samples in the 25 – 75% range into the same group. This recognizes that the primary goal is to determine if a food is above average, average, or below average.
For more information, visit our Knowledge Base at https://lab.realfoodcampaign.org/, where we will continue to update results from 2019 and 2020.